

Jul 28, 2021 Supervised Learning and Regression Analysis in Marketing Analytics
Last time, we introduced the key concepts around understanding the marketing analytics process, the rationale being to help non-technical people understand why they are important and how to build out an analytics capability in your business based on that knowledge. We spoke about concepts such as artificial intelligence, machine learning and supervised vs. unsupervised learning. In this post, we will drill down a bit further into the process by focusing specifically on supervised learning as well as the most commonly used tool in the statistician’s arsenal, regression analysis.
Supervised Learning in Marketing Analytics
If you recall, supervised learning in marketing analytics is a process by which an analyst uses data with known results to “train” a model to predict outcomes outside the data being used to build the model. Usually, this follows a 70/30 format where 70% of the data are used to build the prediction model (i.e. training the data) and 30% of the data are used to test/validate the model on data not included in the model building process. Using one or more statistical criteria, the analyst determines whether or not the model is sufficiently predictive to be used on future data as it is collected. One of the key features of supervised learning is that, in most cases, there is a response or target or “dependent” variable whose behavior one is trying to explain and/or predict against other variables that are driving the behavior of the variable we want to understand. Another key feature is that this process requires that a trained analyst “supervises” the modeling process, testing and retesting models until the best result is obtained. The end result is to create a model that can explain historical data patterns and/or predict future behavior.
Linear Regression in Marketing Analytics
So, what are the most commonly used algorithms in creating these models? The first one is probably the one most often used and with which most laymen have at least a passing understanding…regression analysis. Linear regression consists of regressing a target variable against one or more variables we believe explain the movements in the variable we are interested in. Another way to say this is we find those variables that minimize the variance in the movement of the dependent variable. The regression formula looks as follows:
Y = a + bX1 + cX2 + …zXn + u
Where Y = the target or dependent variable of interest
X = the variables used to explain the pattern of Y (i = 1…n variables)
U = the error associated with estimating the relationship between Y and the X variables
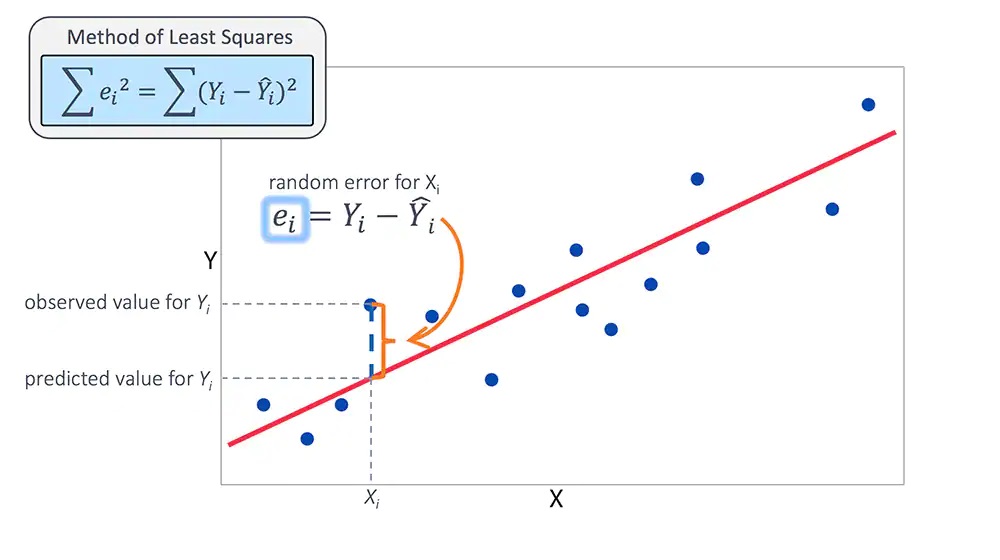
Statisticians use a host of statistical metrics to measure how well the model “fits the data”. They also rely on some very specific assumptions about the nature of the model and the underlying variables in order to make the model viable. A plot of the actual data vs. the values predicted by the regression analysis, such as the one shown above, can be very useful in analyzing “goodness of model fit”.
The estimated value of Y represents the value of the dependent variable predicted by the model and lies on the regression line. The chart shows us just how well we did in mapping the model prediction to the actual data. The model that minimizes the difference in the two is the one used for analysis purposes.
Linear Regression in Advertising
What are some examples of linear regression used in practice? One example is a model where we relate the quantity of a product sold to its price as well as other drivers effecting the product. This is a classic demand model and one of its features is the ability to measure the price elasticity of demand, the impact of the change in the quantity sold resulting from a change in price. Another example in the advertising space is called a marketing mix model. In the model, dollar sales or units sold is the target variable and all forms of advertising as well as economic activity, pricing and other variables such as weather are included as explanatory variables. Of particular interest in this model is the effect of advertising, as measured by the estimated share of total sales associated with each type of advertising. These models typically measure the effect of offline advertising such as TV, radio, print and billboards but can also be used to measure the macro effects of online advertising such as paid media, display ads and social media. The impact of this kind of advertising can also be measured more explicitly through multi-touch attribution analysis, which also uses regression analysis in more sophisticated models to measure which interactions between customers and brands were most important in driving sales or other conversion metrics.
Logistic Regression and Hazard Models in Advertising
While linear regression may be the most commonly used technique, there are other important regression methods to make note of. When we are interested in knowing the probability, or likelihood, of an event occurring, logistic regression is used. Conceptually similar to linear regression, logistic regression is constrained so that the values of the dependent variable lie between 0 and 1 (i.e. 0% and 100% likelihood). This type of model is used when we want to know the probability that someone buys a product or someone responds to an ad asking to sign up for email or website activation, for example. Another type of model is called a hazard model. Here, we are measuring the length of time before an event occurs, such as the number of months before a customer churns out of a mobile phone contract or a subscription service, or the length of time before a machine breaks down in a manufacturing facility.
In the next blog post, we’ll introduce other types of statistical techniques used in supervised learning as well as discuss the basis of unsupervised learning.
Ed Holmquist
Apollo Consulting Group, Providence, RI
No Comments